1. Neuroscientific tool to understand human behaviour
First stage- Behaviour and the brain’s chemical systems
This stage involved identifying from published research the primary behaviour dimensions related to four brain chemical systems comprising neurotransmitters and hormones. It is important to note that all the information used during this stage was obtained from more than 120 published studies by acknowledged experts in the field of neuroscience, and not from any one individual. The number and nature of those studies enhances both the validity of their own findings and the validity of the PRISM measurement scales which are based on those findings.
Second stage-The PRISM behaviour measurement scales
The next stage involved creating, from the extensive data collected at Stage 1, the scales necessary to enable the instrument to become an accurate method of measuring the four primary behaviour groups identified at Stage 1.
To validate the instrument initially, the questionnaire was completed anonymously by 2,437 men and women whose ages ranged from 19 to 60 years of age. The Cronbach’s alpha scores obtained from the sample averaged 0.8 for those groups. Further, refinements to the questionnaire were made in the light of that study.
Third stage – Traditional psychometric measurement and validation techniques
The final stage involved using external academic sources, in 2007 and 2014, to validate, using traditional psychometric validation methods, the measurement scales created at Stage 2 – not the neurobiology which underpins those scales. The most recent independent validity study in 2014 indicated that the Cronbach’s Alpha (internal consistency) scores for all the eight PRISM dimensions averaged 0.9. A general rule of thumb is that solid scientific instruments should have a Cronbach’s Alpha of at least 0.7.
2. PRISM is reliable
PRISM is a very accurate measurement instrument.
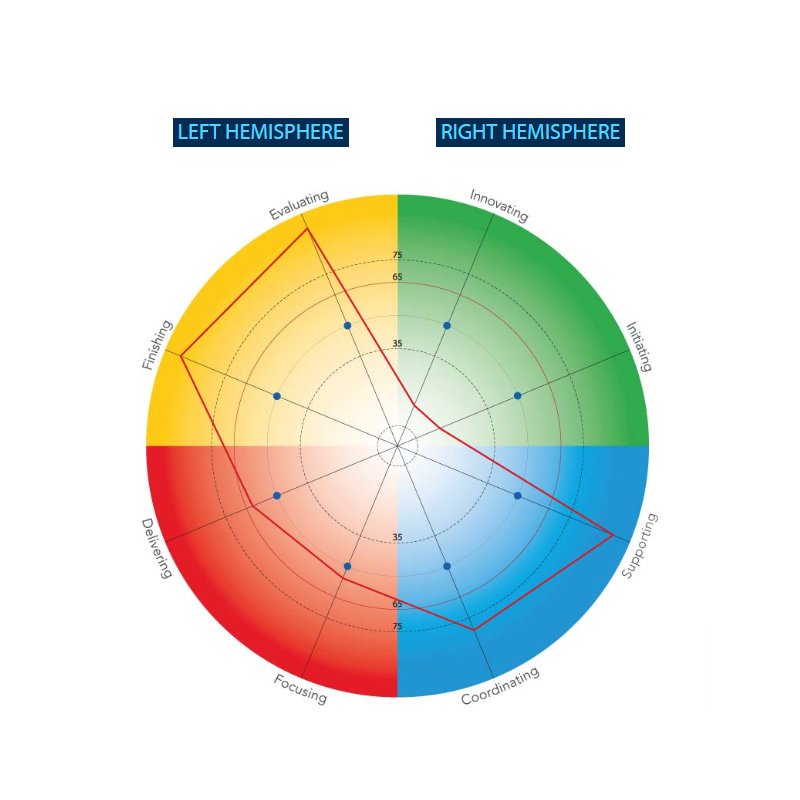
“The validity studies provided strong support for the validity and reliability of the English version of the PRISM scale. These findings are further strengthened by the international and cross-cultural nature of the sample that was used in this study. The power of PRISM is that it is not a classification tool in the traditional sense. In other words, the tool is not used to classify individuals into only one dimension. The PRISM model recognises that individuals will have characteristics from all eight dimensions to a greater or lesser extent. What is produced is a unique ‘brain map’ that shows the individual’s preferred ways of working, and also those behaviours they would rather avoid. ”

What is PRISM?
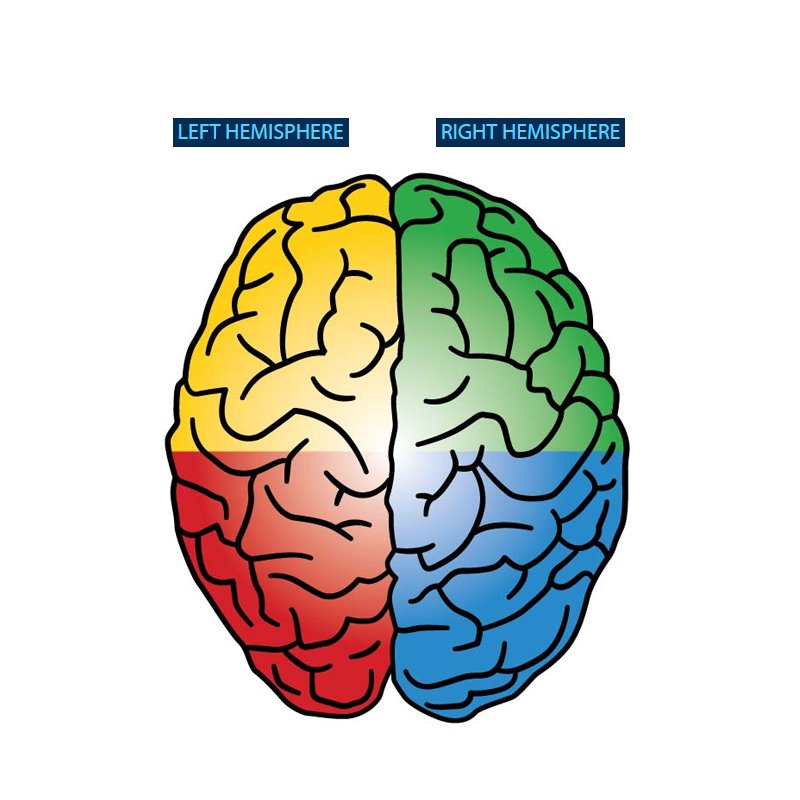
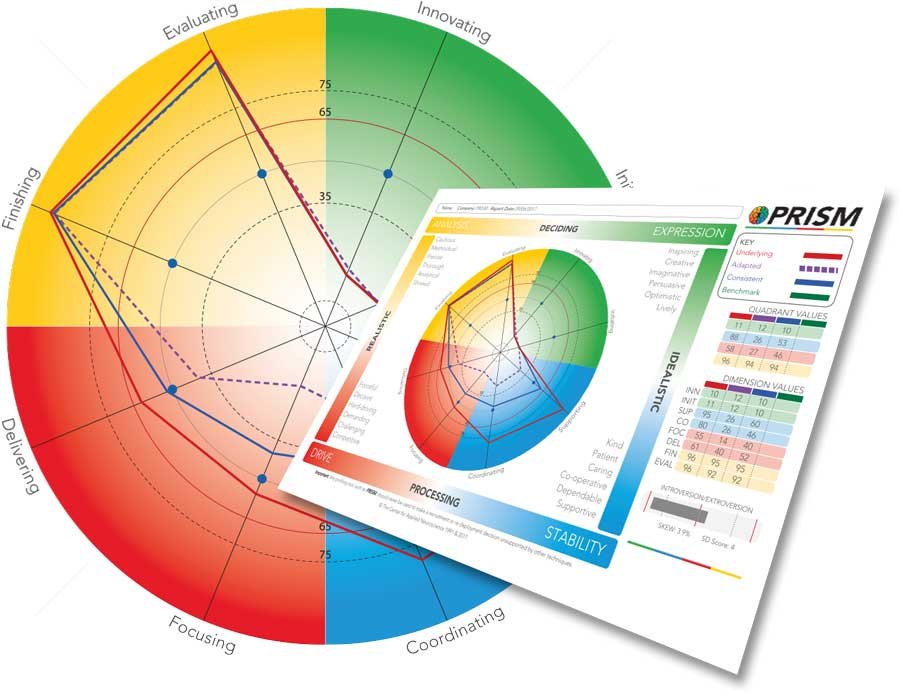
PRISM approaches human behaviour from the perspective of neuroscience, rather than psychological theory. This exciting online tool takes advantage of some of the most up-to-date neuroscience discoveries to provide users with a series of ‘maps’ which are representations of how they prefer to respond to the world around them. At the root of PRISM is the basic fact that all human behaviour is brain driven.
Each PRISM ‘map’ is a picture of the user as a unique individual.
PRISM is not a psychometric test. It is designed to measure self-expressed and observed human behavioural preferences – not personality. The reason for this is that personality is only one of a number of factors, such as our work environment and past experiences, that can influence our overall behaviour. Also, on occasions we can exhibit significant differences between our behaviour and our personality. Unlike many psychometric tests, PRISM is not based on the work of any one individual. It is based on the cumulative research carried out by a significant number of neuroscientists who have contributed much to our current understanding of the brain and behaviour.
PRISM provides a powerful graphic explanation for why people approach situations and individuals in different ways.
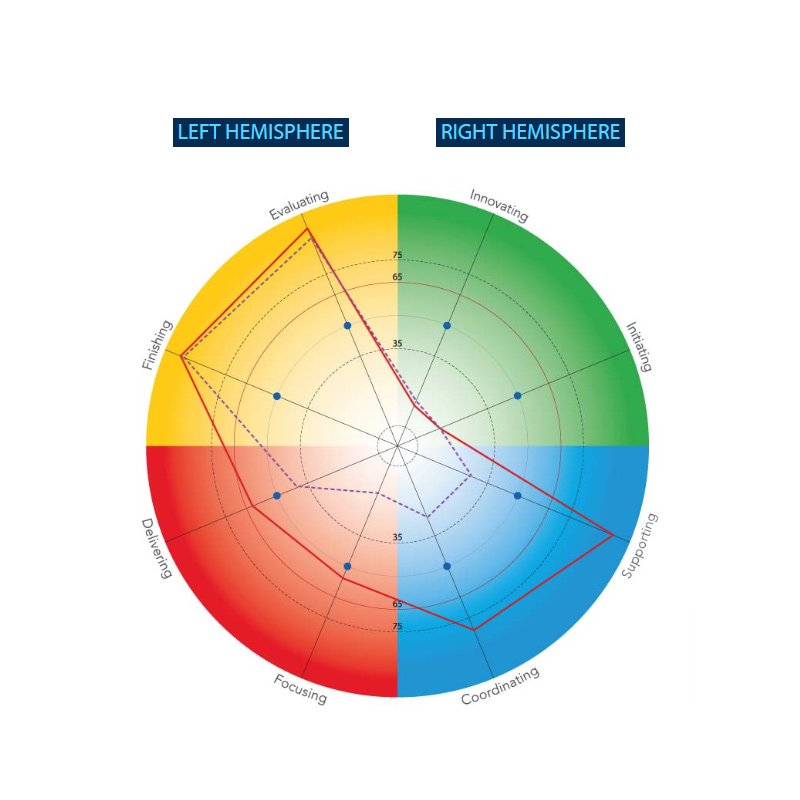
PRISM’s reports show not only people’s natural or instinctive behaviour preference, but also the extent and the way in which they modify or adapt their preference to respond to the demands of specific situations e.g. their job.
The reports also indicate where individuals may be overdoing or not making full use of their preferences. This insight helps them to understand more about their true potential, as well as what may be hindering them from achieving high performance.
The remarkable complexity of the brain has shown that human beings cannot credibly be divided up into a fixed number of types or groups of people who are unable to act outside of their profiles. PRISM does not, therefore, label people or fit them into ‘boxes’, nor does it have ‘scores’, or right or wrong answers. Instead, it provides users with a powerful, graphic explanation for why they approach situations and individuals in different ways.
Because PRISM is based on perception, it is obvious that if perceptions change, behaviour will change too. The dynamic interaction between perception of self and the environment explains why an individual may behave differently from one situation to another.
PRISM is about observed behaviour
All our thoughts, emotions and actions are the results of many parts of the brain acting together.
PRISM’s reports show not only people’s natural or instinctive behaviour preference, but also the extent and the way in which they modify or adapt their preference to respond to the demands of specific situations e.g. their job.
The reports also indicate where individuals may be overdoing or not making full use of their preferences. This insight helps them to understand more about their true potential, as well as what may be hindering them from achieving high performance.
The remarkable complexity of the brain has shown that human beings cannot credibly be divided up into a fixed number of types or groups of people who are unable to act outside of their profiles. PRISM does not, therefore, label people or fit them into ‘boxes’, nor does it have ‘scores’, or right or wrong answers. Instead, it provides users with a powerful, graphic explanation for why they approach situations and individuals in different ways.
Because PRISM is based on perception, it is obvious that if perceptions change, behaviour will change too. The dynamic interaction between perception of self and the environment explains why an individual may behave differently from one situation to another.

3. PRISM report – easy to understand
The PRISM method of presenting behaviour by creating ‘maps’ that are visual representations of a person’s behavioural preferences – as expressed through answers provided to the PRISM questionnaire – is in keeping with the principle of Gestalt psychology. This principle maintains that ‘the whole is different from the sum of its parts’. PRISM emphasises the study of behaviour rather than simply focusing on independently functioning, disparate parts. PRISM is designed to measure a person’s expressed preferences for each of the eight dimensions of behaviour. The expressed preferences are plotted as levels of intensity on eight axes and the plots are joined up to form a ‘map’ which is overlaid on the PRISM schema. The ‘maps’ are designed to show the intensity of the respondent’s self-expressed preferences for the relevant behaviours and not the specific physical location of those behaviours within the brain.
4. PRISM – serves for a different purpose
- Personal development with Professional report, Personal report, Foundation report, 360° Feedback
- Team development with Team Map, Team diagnostic
- Recruitment with Benchmarking map
- Career development with Career explorer
